Explore the console
See the same Pipes and Pipeline from your browser. Continue in the workspace from Your first Pipeline.
Start locally
Install the web console, then start it on loopback:
python -m pip install 'meerschaum[dash]'
mrsm start api -i sql:local --host 127.0.0.1 --port 8001 --secure
Open localhost:8001/dash. On an empty instance, Create admin account sets up its first administrator. Otherwise, sign in with an existing account.
Find your way around
| Page | Try it |
|---|---|
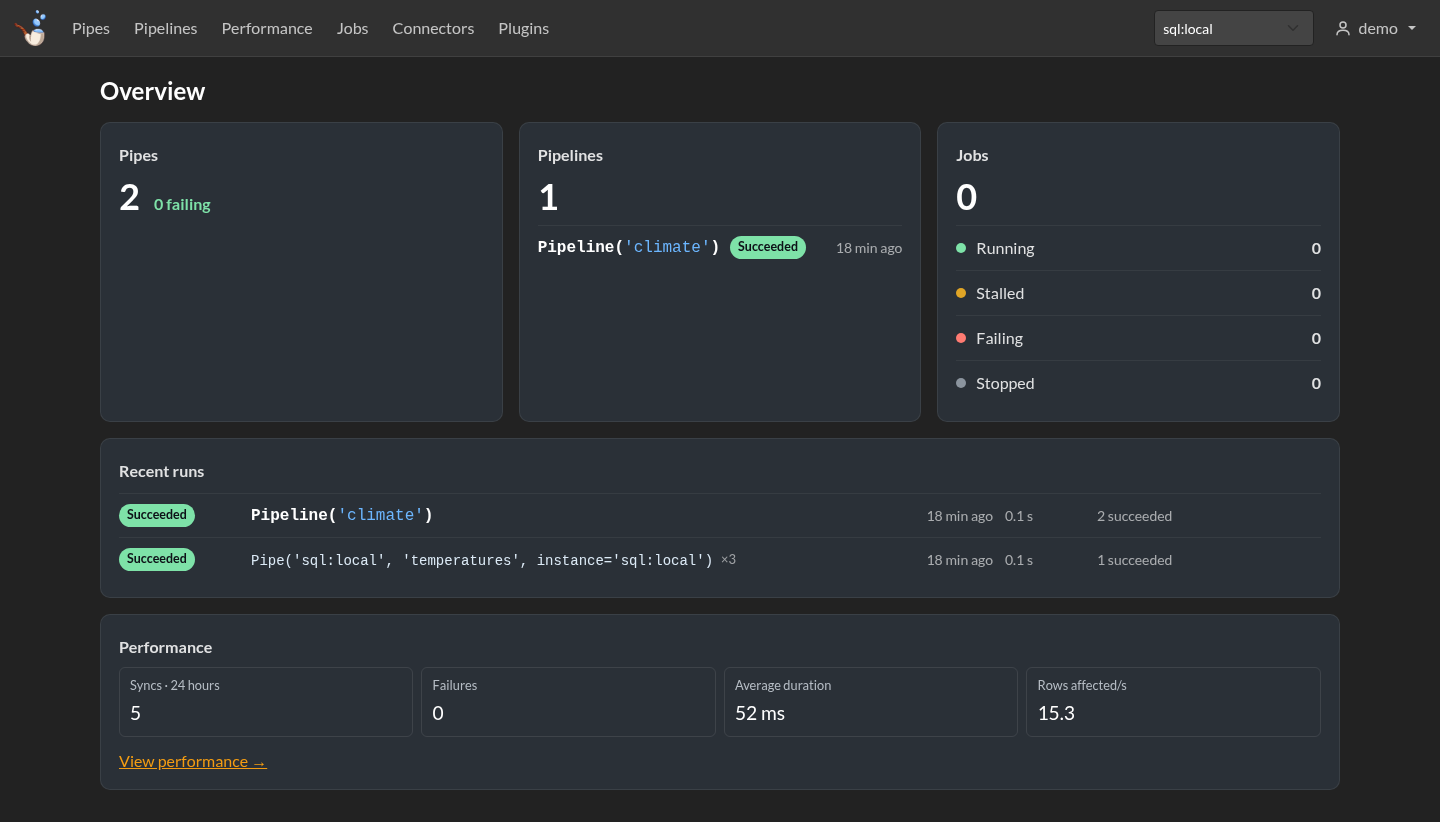
| Overview | See Pipes, Pipelines, jobs, and recent runs together. |
| Pipes | Open temperatures, preview its rows, and inspect its settings. |
| Pipelines | Open climate to explore its graph, preview a plan, and follow runs. |
| Performance | Compare sync duration, failures, and rows affected per second. |
| Jobs | Give a command or Pipeline a schedule and read its logs. |
| Connectors | Inspect masked connection settings and the keys each connector accepts. |
| Plugins | Browse installed and published plugins, and open their source when permitted. |
| Users & Teams | Add people and choose what they may read or change. |
Follow a Pipeline
Open Pipelines → climate. The workspace puts the graph beside the selected Pipe's details. The Runs tab shows its history and what each step did.
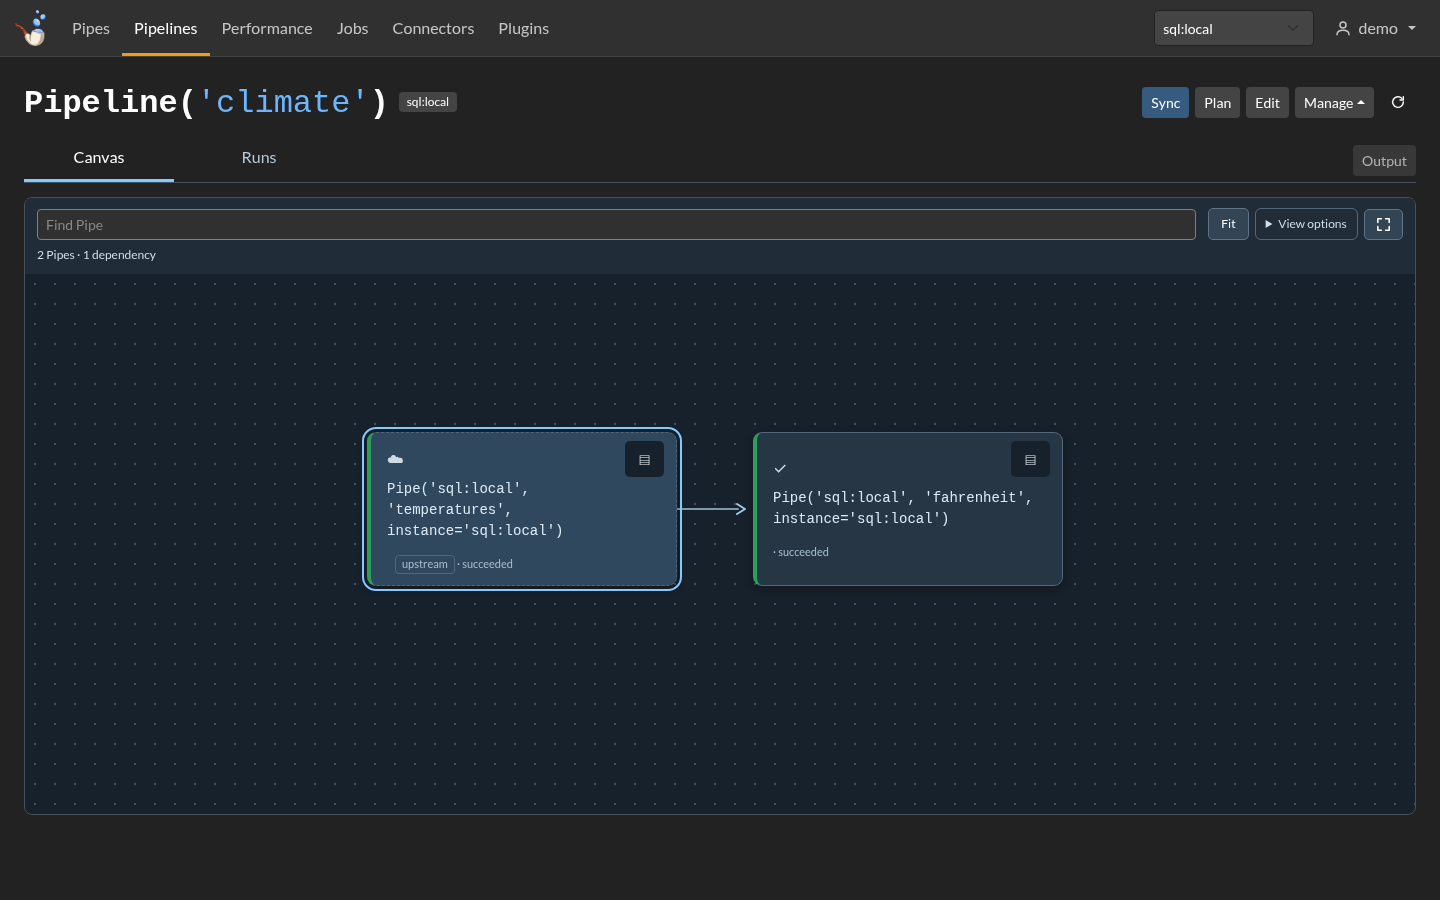
On a phone, switch between Graph, Pipe details, and Output to focus on one thing at a time.
The Performance page follows the same work over time. Filter by climate to see its runs and sync measurements. See Sync metrics for the chart labels and history limits.
Share with a team
An administrator can create users and teams. Give readers access to the data they need, and give editors only the actions they need. The console shows controls that match their permissions.
See Access and locks and Console permissions.
Press Ctrl+C in the server terminal when you're finished.
For HTTPS and a shared deployment, follow the API instance guide.