Sync metrics
Find slow or failing syncs, and see how much data each Pipe or Pipeline changes.
In the console
Open Performance in the navigation, or choose View performance on the Overview card. Pick a time window, then narrow it to a Pipe or Pipeline.
- Duration shows the average time per sync.
- Write rate shows rows affected/s.
- Results shows successful and failed syncs over time.
The tables below compare Pipes and Pipelines. Choose a name to narrow the view; use your browser's Back button to return. Recent syncs shows 50 outcomes per page. Changing a filter starts at the first page; Refresh keeps your place and reads the latest measurements.
Hover over a chart for its values; drag to zoom and double-click to reset.
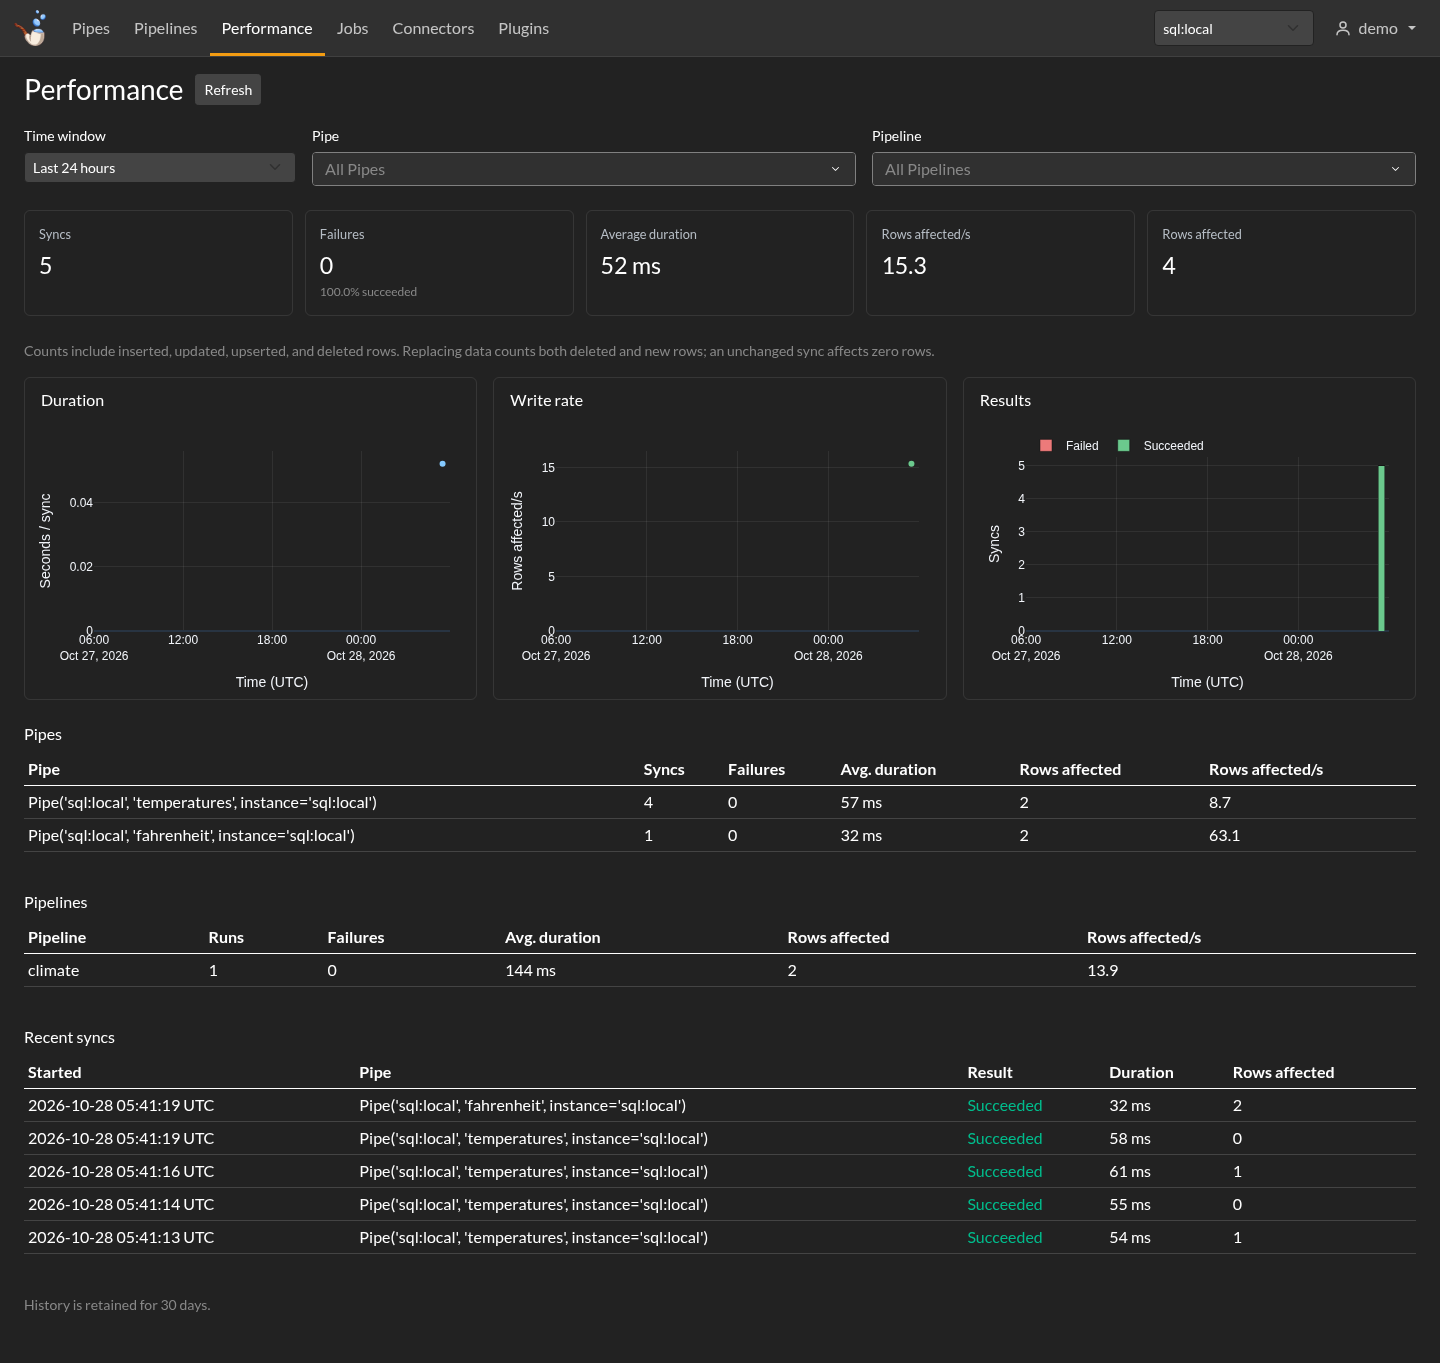
Rows affected counts inserted, updated, upserted, and deleted rows. Replacing data counts the deletion and the new rows. An unchanged sync affects zero rows, even when it spends time fetching or checking data.
From Python
Read measurements from your instance:
import meerschaum as mrsm

metrics = mrsm.get_engine_metrics(instance='sql:local', pipeline='climate')
summary = metrics['summary']
print(summary['syncs'], 'syncs;', summary['failed'], 'failed')
print(summary['avg_duration_seconds'], 'seconds per sync')
Leave out pipeline for every Pipe, or pass a Pipe as pipe=. Use UTC datetimes for begin= and end= to choose a window.
History, limits, and access
- History is retained for 30 days. The default query covers the last 24 hours.
- SQL totals and charts cover the chosen window. Recent history is separate: 1,000 records in the console, up to 5,000 in the SDK. Check
summary_completeandhistory_truncatedfor coverage. - Backend or Pipeline run limits may produce sampled totals. The page labels these; filter by Pipe or choose a shorter window for more detail. Use
summary_only=Truefor summary cards without history or run details. - Capture runs in the background and is best effort. Queue or database pressure can drop a measurement without failing the sync.
- The console and HTTP API filter by your current Pipe, Pipeline, and team access before calculating results. An access change starts a new visible history segment.
- Clients from before 5.0.0rc16 do not backfill detailed sync history.
- The local Python SDK uses the instance's credentials. A hosted interface must supply its own access checks.
In Grafana
Storage
SQL instances keep measurements in the internal mrsm_engine_metrics table, with time, Pipe, run, and registration indexes. TimescaleDB uses 30-day chunks on a microsecond time axis. Upgrading an RC installation corrects undersized intervals for future chunks; retained history stays intact.
The Stack dashboards show the same affected-row, duration, and failure measurements.
Grafana reads directly with the database credentials configured for its data source. Its visibility follows those database permissions; the console and HTTP API apply their Pipe and team access rules.